
13 Questions to Pass your Statistics Test
by Lei Bao
Numerically Summarizing Data
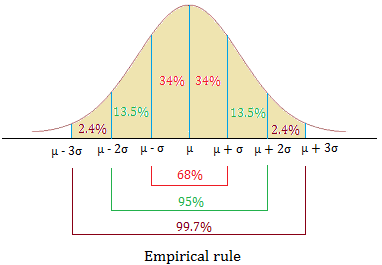
Empirical Rule
If the shape of the distribution is bell-shaped, then
- Approximately 68% of the data lie within 1 standard deviation of the mean
- Approximately 95% of the data lie within 2 standard deviations of the mean
- Approximately 99.7% of the data lie within 3 standard deviations of the mean
Sample Question 1
Assume that the random variable x is normally distributed, with mean = 45 and standard deviation = 14. Compute the probability P ( 55 x 70).
- Population z-score:
- z-score for x = 70:
- z-score for x = 55:
- Area in left tail for : 0.9633
- Area in left tail for : 0.7611
- Area between and : 0.9633 - 0.7611 = 0.2022
Sample Question 2
The number of chocolate chips in an 18-ounce bag of chocolate chip cookies is approximately normally distributed with mean 1252 and standard deviation 129 chips.
What is the probability that a randomly selected bag contains between 1000 and 1400 chocolate chips?
- Population z-score:
- z-score for x = 1400:
- z-score for x = 1000:
- Area in left tail for : 0.8749
- Area in left tail for : 0.0256
- Area between and : 0.8794 - 0.0256 = 0.8538
What is the probability that a randomly selected bag contains fewer than 1000 chocolate chips?
- z-score for x = 1000:
- Area in left tail for z: 0.0256
What proportion of bags contains more than 1200 chocolate chips?
- z-score for x = 1200:
- Area in left tail for z: 0.3446
- Area in right tail for z: 1 - 0.3446 = 0.6554
What is the percentile rank of a bag that contains 1050 chocolate chips?
- z-score for x = 1050:
- Area in left tail for z: 0.0582 (6th percentile)
The Normal Distribution
Sample Question 3
Suppose a brewery has a filling machine that fills 12-ounce bottles of beer. It is known that the amount of beer poured by this filling machine follows a normal distribution with a mean of 12.15 ounces and a standard deviation of 0.04 ounce. The company is interested in reducing the amount of extra beer that is poured into the 12 ounce bottles. The company is seeking to identify the highest 1.5% of the fill amounts poured by this machine. For what fill amount are they searching? Round to the nearest thousandth.
- Area in left tail for z: 1 - 0.015 = 0.985
- z score for 0.985: 2.17
- x:
Sampling Distributions
Mean and Standard Deviation of the Sampling Distribution of
Suppose a simple random sample of size n is drawn from a large population with mean and standard deviation . The sample distribution of has mean = , and standard deviation = .
Sample Proportion
Assume the size of the population is 15,000, n = 700, and p = 0.3. Describe the sampling distribution of .
- Approximately normal because and
Determine the mean of the sampling distribution of .
Determine the standard deviation of the sampling distribution of .
Sample Question 4 (Mean and Standard Deviation of the Sample Distribution of )
Suppose a geyser has a mean time between eruptions of 79 minutes. Let the interval of time between the eruptions be normally distributed with standard deviation 30 minutes. Complete parts 1 through 5 below.
What is the probability that a randomly selected time interval between eruptions is longer than 92 minutes?
- z-score for x = 92:
- Area in left tail for z:
- Area in right tail for z: 1 - 0.6664 = 0.3336
What is the probability that a random sample of 12 time intervals between eruptions has a mean longer than 92 minutes?
- Area in left tail for
- Area in right tail for : 1 -0.9332 = 0.0668
What is the probability that a random sample of 23 time intervals between eruptions has a mean longer than 92 minutes?
- Area in right tail for : 1 -0.9812 = 0.0188
What effect does increasing the sample size have on the probability? Provide an explanation for this result.
- If the population mean is less than 92 minutes, then the probability that the sample mean of the time between eruptions is greater than 92 minutes decreases because the variability in the sample mean decreases as the sample size increases.
What might you conclude if a random sample of 23 time intervals between eruptions has a mean longer than 92 minutes? Select all that apply.
- The population mean may be greater than 79.
- The population mean is 79, and this is just a rare sampling.
Sample Question 5 (Mean and Standard Deviation of the Sample Distribution of )
A survey of 2303 adults in a certain large country aged 18 and older conducted by a reputable polling organization found that 407 have donated blood in the past two years. Complete parts 1 through 3 below.
Obtain a point estimate for the population of adults in the country aged 18 and older who have donated blood in the past two years.
- Sample Proportion:
Verify that the requirements for constructing a confidence interval about p are satisfied.
- The sample can be assumed to be a simple random sample, the value of is 335.335, which is greater than or equal to 10, and the sample size can be assumed to be less than or equal to 5% of the population size.
Construct and interpret a 90% confidence interval for the population proportion of adults in the country who have donated blood in the past two years. Select the correct choice below and fill in any answer boxes within your choice.
- A confidence interval about p is:
- Lower bound:
- Upper bound:
- We are 90% confident the proportion of adults in the country aged 18 and older who have donated blood in the past two years is between 0.164 and 0.190.
Sample Question 6 (Sample Size)
A researcher wishes to estimate the percentage of adults who support abolishing the penny. What sizes sample should be obtained if he wishes the estimate to be within 5 percentage points with 90% confidence if
He uses a previous estimate of 34%?
- To estimate the population proportion with a margin of error E at a level of confidence: =
He does not use any prior estimates?
Estimating the Value of a Parameter
Sample Question 7 (Confidence Intervals)
A survey was conducted that asked 974 people how many books they had read in the past year. Results indicated that books and s = 15.9 books. Construct a 98% confidence interval for the mean number of books people read. Interpret the interval.
- A confidence interval about :
- Lower bound:
- Upper bound:
Sample Question 8 (Sample Size)
A doctor wants to estimate the mean HOL cholesterol of all 20- to 29-year-old females. How many subjects are needed to estimate the mean HDL cholesterol within 2 points with 99% confidence assuming s = 15.9 based on earlier studies? Suppose the doctor would be content with 95% confidence. How does the decrease in confidence after the sample size required?
- A 99% confidence level requires subjects
- A 95% confidence level requires subjects.
- Decreasing the confidence level decreases the sample size needed.
Hypothesis Tests Regarding a Parameter
Sample Question 9 (Test Statistics)
For students who first enrolled in two year public institutions in a recent semester, the proportion who earned a bachelor’s degree within six years was 0.399. The president of a certain college believes that the proportion of students who enroll in her institution have aa higher completion rate.
- Determine the null and alternative hypotheses.
- Explain what it would mean to make a Type I error.
- Explain what it would mean to make a Type II error.
State the hypotheses.
- : p 0.399
- : p 0.399
Type I error
- A Type I error is committed when the null hypothesis is rejected when, in fact, it is true.
- The president rejects the hypothesis that the proportion of students who earn a bachelor’s degree within six years is 0.399, when, in fact, the proportion is 0.399
Type II error
- A Type II error is committed when the null hypothesis is not rejected when, in fact, the alternative hypothesis is true.
- The president fails to reject the hypothesis that the proportion of students who earn a bachelor’s degree within six years is 0.399, when, in fact, the proportion is greater than 0.399.
Sample Question 10 (Test Statistics)
According to a polling organization, 24% of adults in a large region consider themselves to be liberal. A survey asked 200 respondents to disclose their political philosophy: Conservative, Liberal, Moderate. Treat the results of the survey as a random sample of adults in this region. Do the survey results suggest the proportion is higher than that reported by the polling organization? Use an level of significance.
Because ; the sample size is less than 5% of the population size, and the sample is given to be random, the requirements for testing the hypothesis are satisfied.
Identify the null and alternative hypotheses for this test. Let p represent the population proportion of adults in this region who consider themselves to be liberal.
- : p = 0.24 versus : p > 0.24
Find the test statistic, , for this hypothesis test.
- ,
Determine the P-value for this hypothesis test.
- P-value = 0
If P-value < , reject the null hypothesis. Otherwise, do not reject the null hypothesis.
- Reject . There is sufficient evidence at the level of significant to conclude that the proportion is higher than that reported by the polling organization.
Sample Question 11 (Test Statistics)
The mean waiting time at the drive-through of a fast-food restaurant from the time an order is placed to the time the order is received is 83.7 seconds. A manager devises a new drive-through system that she believes will decrease wait time. As a test, she initiates the new system at her restaurant and measures the wait time for 10 randomly selected orders. The wait times are provided in the table to the right. Complete parts 1 and 2 below. (105.6, 66.2, 59.0, 75.0, 66.0, 80.2, 93.4, 84.2, 70.4, 80.0)
Because the sample size is small, the manager must verify the wait time is normally distributed and the sample does not contain any outliers. The normal probability plot is shown below and the sample correlation coefficient is known to be r = 0.977. Are the conditions for testing the hypothesis satisfied?
- Yes, the conditions are satisfied. The normal probability plot is linear enough, since the correlation coefficient is greater than the critical value.
Is the new system effective? Conduct a hypothesis test using the P-value approach and a level of significance of .
- :
- :
The test statistic follows a t-distribution with n-1 degrees of freedom. A P-value is the probability of observing a sample statistic as extreme as or more extreme than one observed under the assumption that the statement in the null hypothesis is true. Either use the t-distribution table to find the range of critical values that the test statistic falls in to approximate the P-value, or use technology to determine the P-value with n-1 degrees of freedom. Note that this is a left-tailed test.
- The P-value is in the range P-value > 0.10
Use the Level of significance. What can be concluded from the hypothesis test?
- The P-value is greater than the level of significance so there is not sufficient evidence to conclude the new system is effective.
Inferences on Two Samples
Sample Question 12 (Independent Samples)
An educator wants to determine whether a new curriculum significantly improves standardized test scores for third grade students. She randomly divides 80 third-graders into two groups. Group 1 is taught using the traditional curriculum, while group 2 is taught using the new curriculum. At the end of the school year, both groups are given the standardized test and the mean scores are compared. Determine whether the sampling is dependent or independent. Indicate whether the response variable is qualitative or quantitative.
- This sampling is independent because the individuals selected for one sample do not dictate which individuals are to be in a second sample.
- The variable is quantitative because it is a numerical measure.
Sample Question 13 (Test Statistic Comparing Two Population Proportions)
In 1945, an organization surveyed 1100 adults and asked, “Are you a total abstained from, or do you on occasion consume, alcoholic beverages?” Of the 1100 adults surveyed, 396 indicated that they were total sustainers. In a recent survey, the same question was asked of 1100 adults and 319 indicated that they were total abstainers. Complete parts 1 and 2 below.
Determine the sample proportion for each sample.
- The proportions of the adults who took the 1945 survey and the recent survey who were total abstainers are 0.36 and 0.29, respectively.
Has the proportion of adults who totally abstain from alcohol changed? Use the level of significance.
First verify the model requirements. Select all that apply.
- and
- The sample size is less than 5% of the population size for each sample
- The samples are independent.
Identify the null and alternative hypotheses for this test. Let represent the population proportion of 1945 adults who abstainers and represent the population of recent adults who were total abstainers.
Determine the null and alternative hypotheses.
- :
- :
Find the test statistic for this hypothesis test.
Determine the P-value for this hypothesis test: 0
Interpret the P-value
- If the population proportions are equal, one would expect a sample difference proportion greater than the absolute value of the one observed in about 0 out of 100 repetitions of this experiment.
State the conclusion for this hypothesis test.
- Reject . There is sufficient evidence at the level of significance to suggest the proportion of adults who totally abstain from alcohol has changed.
No comments:
Post a Comment